Tradeweb Exchange-Traded Funds Update – June 2024
The following data is derived from trading activity on the Tradeweb Markets institutional European- and U.S.-listed ETF platforms.
EUROPEAN-LISTED ETFs
Total traded volume
Trading activity on the Tradeweb European ETF marketplace reached EUR 51.7 billion in June. The percentage of transactions processed via Tradeweb’s Automated Intelligent Execution (AiEX) tool amounted to 87.6%, the second-highest figure on record, while the proportion of volume was 22.7%.
Adam Gould, head of equities at Tradeweb, said: “We saw another strong quarterly performance on our European platform, with trading volume totalling EUR 153.9 billion, an increase of 15.3% compared to the same period last year. Meanwhile, clients have continued to embrace our automated rules-based trading protocol to capitalise on strategic trading opportunities and increase reactivity to market conditions.”
Volume breakdown
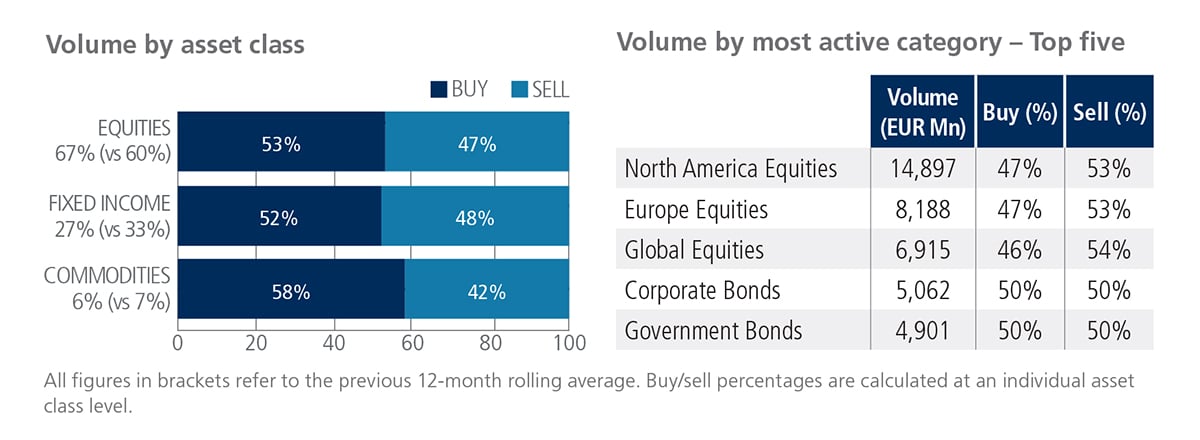
In June, trading activity in equity-based ETFs registered at 67% of the overall platform flow, while fixed income and commodities were at 27% and 6%, respectively. ‘Buys’ exceeded ‘sells’ for all ETF asset classes, particularly in equities and commodities. North American Equities was the most heavily-traded ETF category, with EUR 14.9 billion in total notional volume.

Top ten by traded notional volume
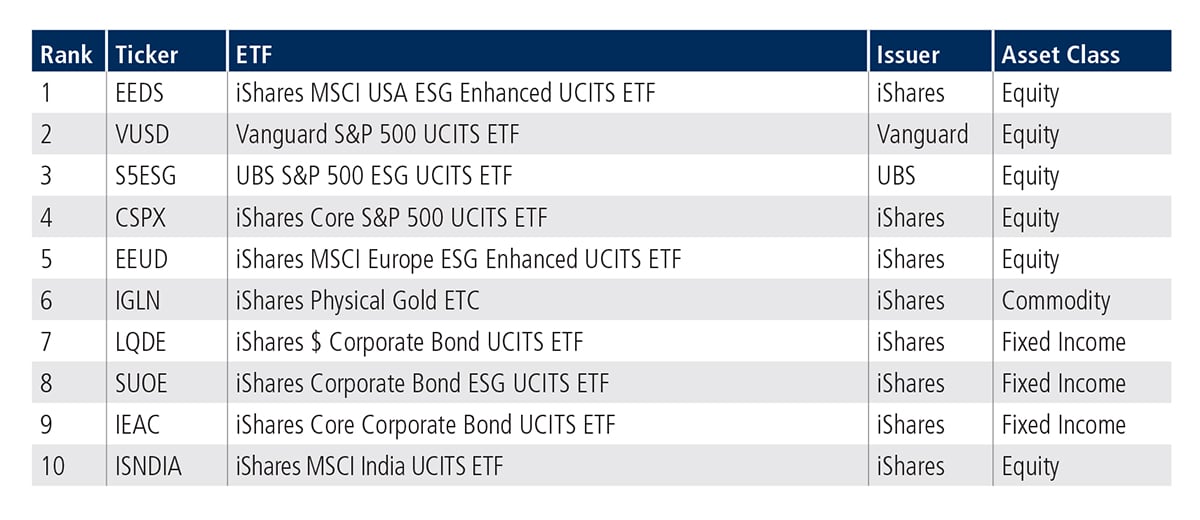
Six of the top ten ETFs by traded notional volume were equity-based products. The iShares MSCI USA ESG Enhanced UCITS ETF, which ranked first in June, offers exposure to U.S. equities. The prior month’s top product, iShares Core Corporate Bond UCITS ETF, moved down to ninth position in June, while the Vanguard S&P 500 UCITS ETF, which last appeared in the top three in January 2023, ranks in second place.

U.S.-LISTED ETFs
Total traded volume
Total consolidated U.S. ETF notional value traded in June reached USD 50.2 billion.
Adam Gould, head of equities at Tradeweb, said: “In the U.S., total traded volume in the second quarter of this year was USD 154.4 billion, growing by 2.5% year-over-year, reflecting another strong period of institutional ETF trading activity.”
Volume breakdown
As a percentage of total notional value, equities accounted for 66% and fixed income for 29%, with the remainder comprising commodity and specialty ETFs.

Top ten by traded notional volume
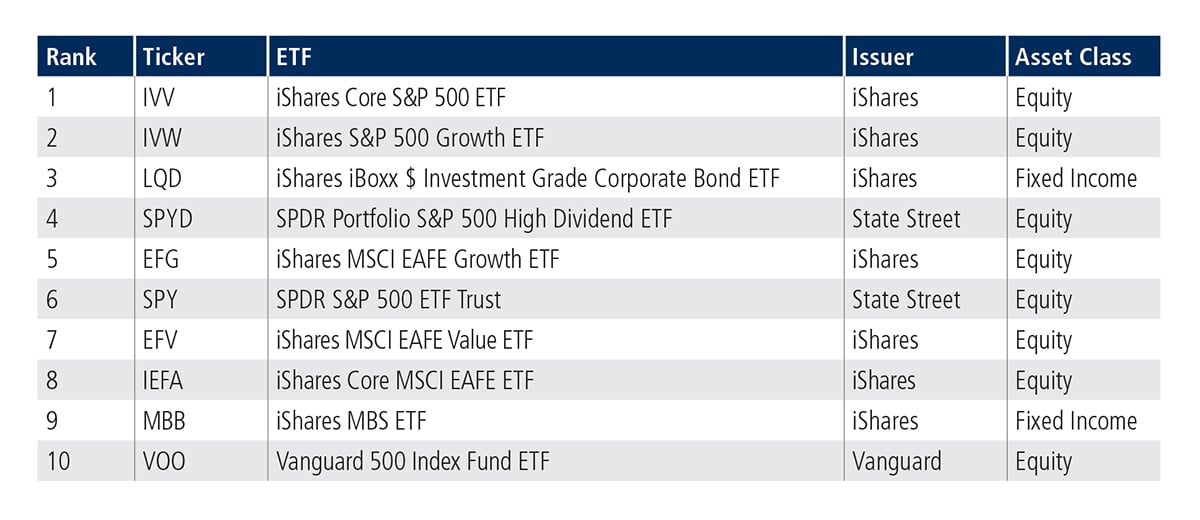
In a reversal of last month’s trend, where fixed income products dominated the top ten, equity products occupied eight of the top places in June’s ETF list. The two fixed income-based products ranked invest in U.S. bonds. The iShares Core S&P 500 ETF moved up one spot to rank first, while the iShares iBoxx $ Investment Grade Corporate Bond ETF also moved up one place to be in the top three.

Related Content